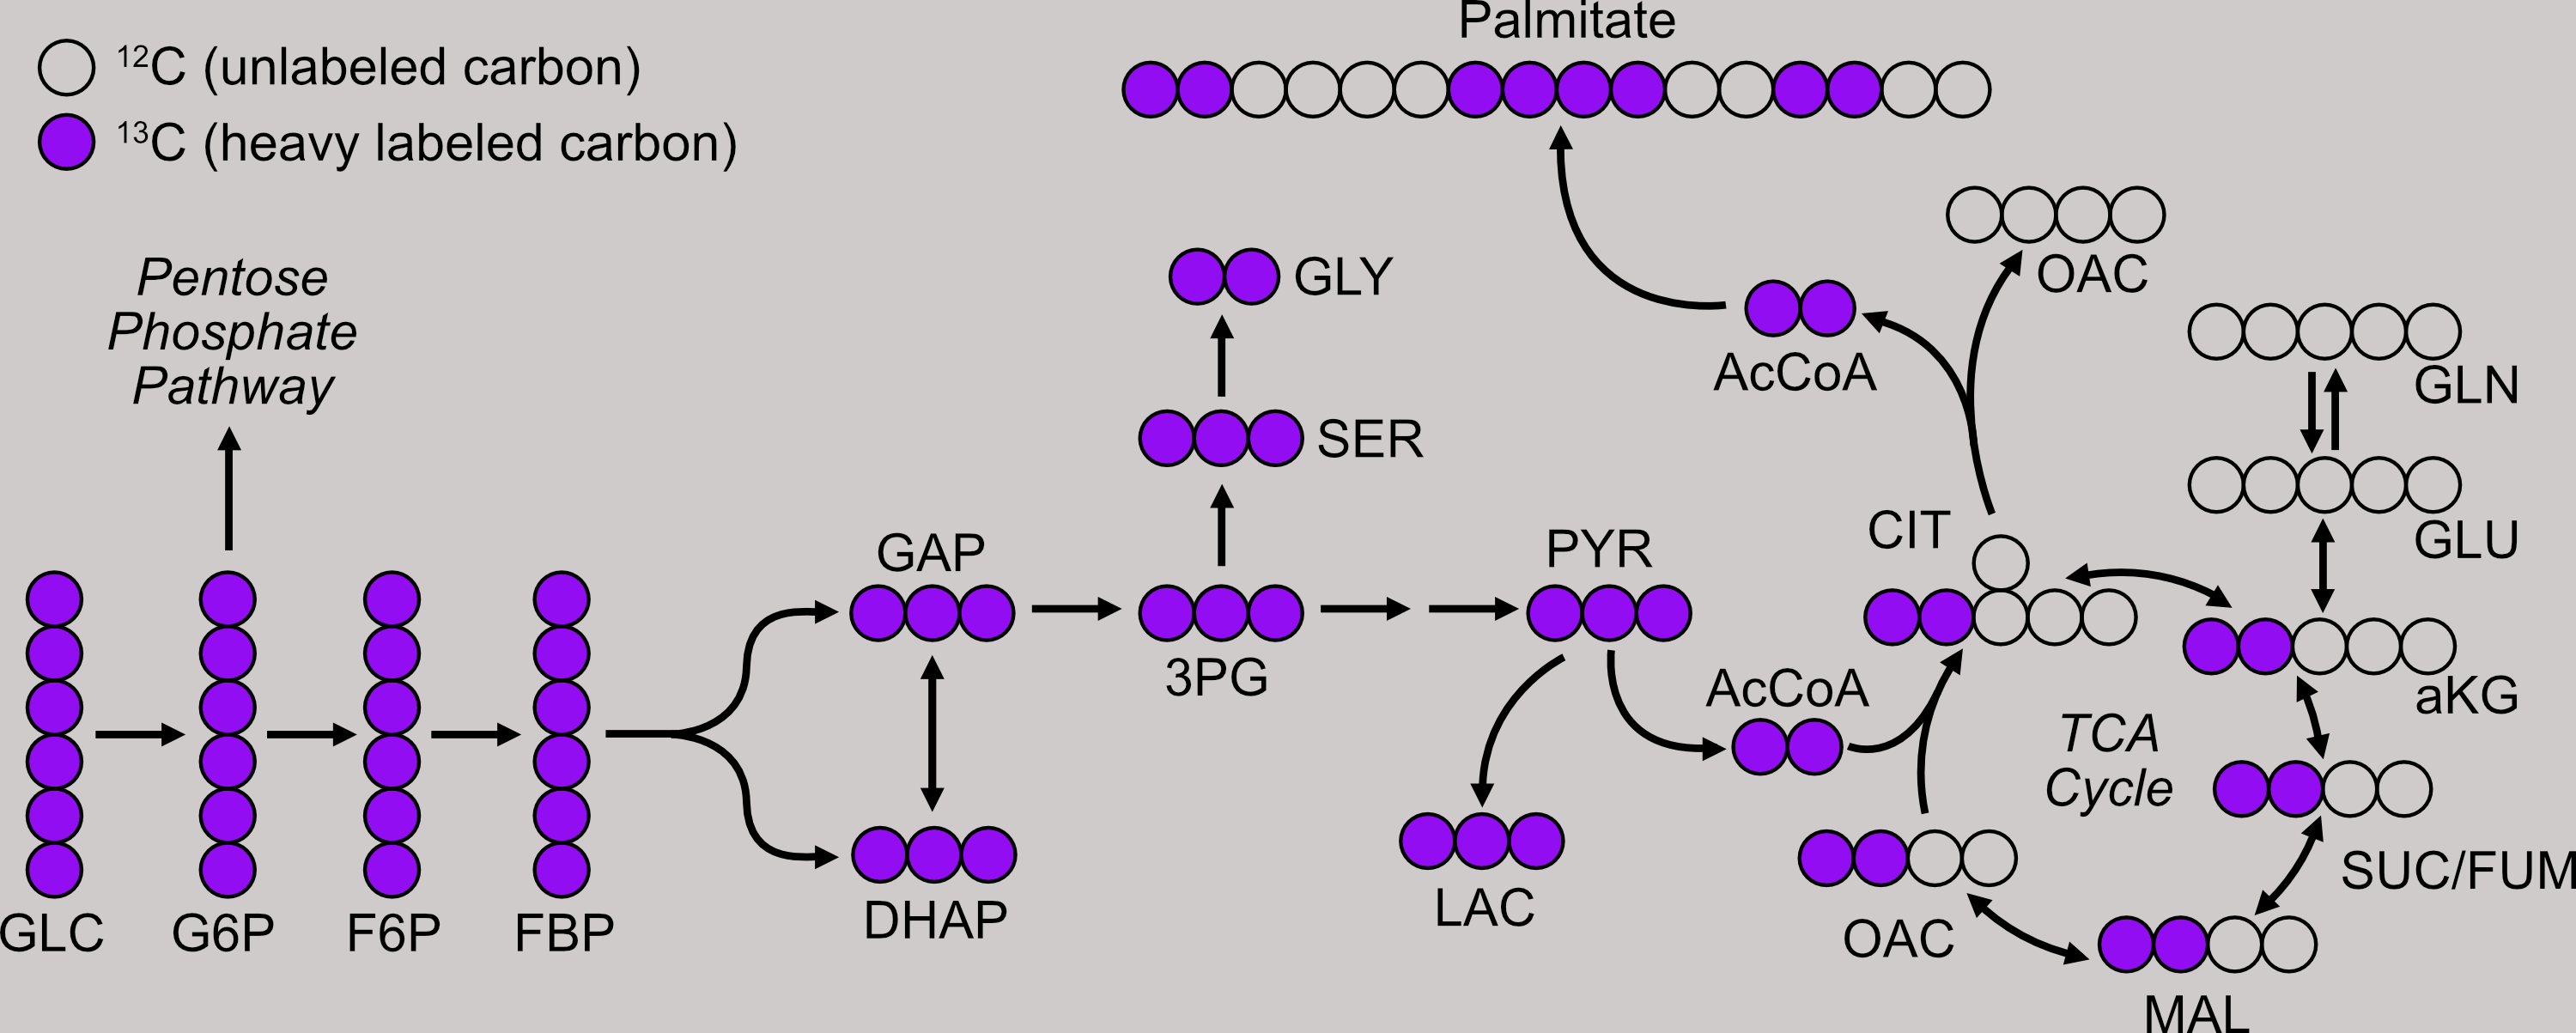
All of the cells in our bodies require energy to perform their specific functions and raw materials to maintain their infrastructures. Both the energetic substrates and biosynthetic raw materials are derived from the nutrients in the cell micro-environment. Depending on its function, the stresses it faces, or demands placed on the cell; these nutrients will be processed in different proportions by distinct metabolic pathways.

Consider the metabolism of glucose, which serves as both an energetic fuel and a biosynthetic substrate. We can feed cells glucose where the carbon atoms are labeled with an extra neutron, allow the cells to metabolize the glucose, and analzye the intracellular metabolites on a mass spectrometer to determine where the labeled carbon has propagated. For instance, if we see a large proportion of malate with two or four heavy-labeled carbon atoms, we know the cells are relying heavily on the TCA cycle for energy production. Conversely, if we do not see an abundance of two- and four-carbon labeled malate, the cells must be acquiring their energy by other means.
Utilization of these metabolic pathways is tightly regulated to ensure cell-type specific energetic and biosynthetic demands are efficiently satisfied. However onset of chronic disease such as type II diabetes or cancer, overnutrition, or malnutrition can lead to the dysregulation of these pathways and have far-reaching consequences. We attempt to mitigate these consequences by restoring proper metabolic regulation by identifying potential drug targets or molecular level nutrient interventions.
The majority of cellular functions are performed by proteins. Thus direct quantification of protein products theoretically provides a better inference for gene activity than quantification of mRNA. Our group focuses on cellular metabolism and is interested in functional adaptations to nutrient stresses. We assay cellular adaptations on a global scale using high resolution isoelectric focusing fractionation coupled to LC-MS/MS based proteomics (Branca et al, Nature Methods 2014). This methodology allows for in-depth quantification where co-function of proteins is often characterized by high correlation.

The three genes shown above code for structural members of complex I of the electron transport chain. Individual breast tumors of the specified subtypes are represented on the x-axis. The abundance traces for each gene tightly overlap in the protein plot. This is because protein members of a complex are required for the complex to function. Thus if a tumor relies heavily on the function of a protein complex, it is relying heavily on all of the members of that complex. The same is not necessarily true of mRNA because the presence of mRNA is not required for protein function. Thus the abundance traces for mRNA do not overlap as tightly. The same concept can be extended to proteins that are not necessarily part of the same complex, but work in groups to perform a function; all protein members of the group must be present for the function to be performed. Thus by examining correlations in high-resolution quantitative proteomics data sets, we can postulate protein co-function and regulatory relationships. Similar relationships among other proteins can be explored in our Data Portal.
The above data is from Johansson, et al. Nature Communications 2019. Protein data is relative to an internal standard, log2 transformed, and then standardized (z-score).
While reliably quantifying thousands of proteins per sample provides an in-depth characterization of a biological system, it also presents the challenge to determine which proteins provide potential avenues for therapeutic intervention. We apply bioinformatic techniques such as hierarchical clustering, network analyses, and enrichment analyses to obtain insights into molecular mechanisms from our proteomic and metabolic measurements. We can then execute experiments designed based on our observations to test our hypotheses.

In the above image, proteins are represented by the circles. The correlation of their abundance adaptations to a drug across breast cancer cell lines is indicated by the color. Proteins whose adaptations correlate with each other are linked. Circles are arranged to minimize edge length (in a constrained manner) revealing regulatory nodes. Nodes of dark red are theoretical positive regulators and those of dark blue are theoretical negative regulators of the adaptation. Thus inhibiting the protein members of the dark red nodes or agonizing pathways highlighted by the blue nodes may circumvent tumor drug-resistance mechanisms. Only proteins having differential responses to treatment are shown.
Breast cancer is clinically classified based on the expression of four proteins identified immunohistochemistry: the estrogen receptor (ER), the human growth factor epidermal receptor 2 (HER2), the progesterone receptor (PR), and MKI67 (a marker of proliferation). Targeted therapies are available only for tumors expressing ER or HER2. However, the presence of these markers do not exclude patients from requiring surgery and chemotherapeutics with harsh side effects. Patients with triple-negative tumors rely more heavily on general chemotherapeutics because there are no drugs that target their tumors.

We take a systems approach to target the progression of triple-negative breast cancer to a metastatic disease. We apply proteomics and stable-isotope tracing to understand the mechanisms triple-negative breast tumor cells use to survive as non-adherent and in low-oxygen environments.
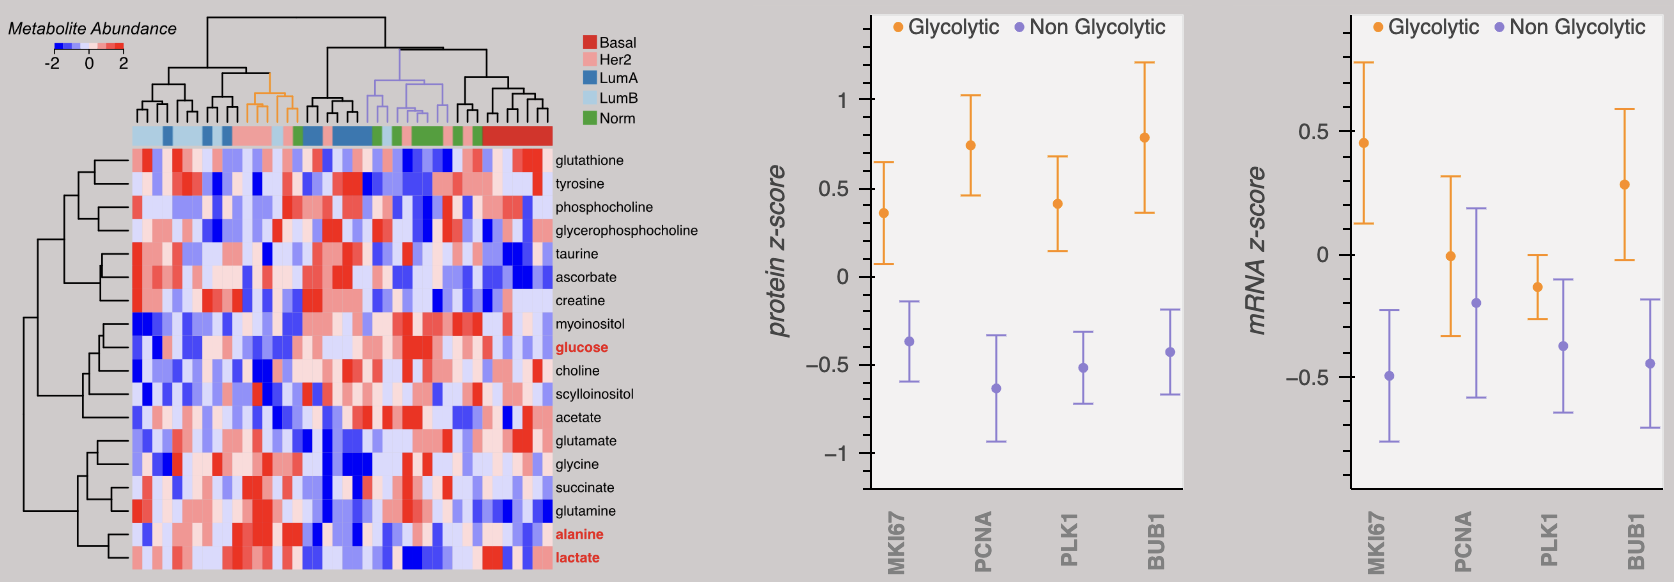
We are motivated to vertically integrate studies of protein and metabolic adaptations by findings that independent measures of gene expression signatures and metabolic function classify breast tumors in accordance with the clinic. Above, breast tumors are clustered based on metabolite abundances resulting in classifications consistent with the clinical PAM50 molecular signatures. Identification of "Glycolytic" and "Non Glycolytic" clusters predicts protein abundances of proliferative markers, where Glycolytic breast tumors are likely to have higher abundances.
The above data is from Johansson, et al. Nature Communications 2019. Breast tumor protein and mRNA expression can be further explored in our Data Portal.