Breast cancer is widely classified based on the expression of four proteins identified clinically by immunohistochemistry: the estrogen receptor (ER or ESR1), the human growth factor epidrmal receptor 2 (HER2 or ERBB2), the progeserone receptor (PR or PGR), and MKI67 (a marker of proliferation). Currently targeted therapies are available only for tumors expressing ER or HER2. However the presence of these markers do not exclude patients from requiring surgery and harsh therapies with general chemotherapeutics and radiation. These therapies are even harsher for patients with triple-negative tumors because drugs do not exist that target their tumors. These shortcomings have motivated an increase in efforts to develop new therapies; however these efforts have not been accompanied by a strong impact on breast cancer mortality rates in cases where the tumor has metastasized.


We believe that an effective relationship between the number of therapies under development and the breast cancer mortality rate can be restored, and more effective targeted therapies can be developed by motivating therapy development based on tumor proteome adaptations. This had not been possible due to technical limitations of proteomics; however proteomics platforms have made large strides in recent years. Nearly 10,000 proteins can be quantified per tumor using high resolution isoelectric focusing fractionation followed by LC-MS/MS based proteomics. This is the only proteomics methodology that has independently classified breast cancer patients in accordance with their clinical markers and is the method we regularly employ.
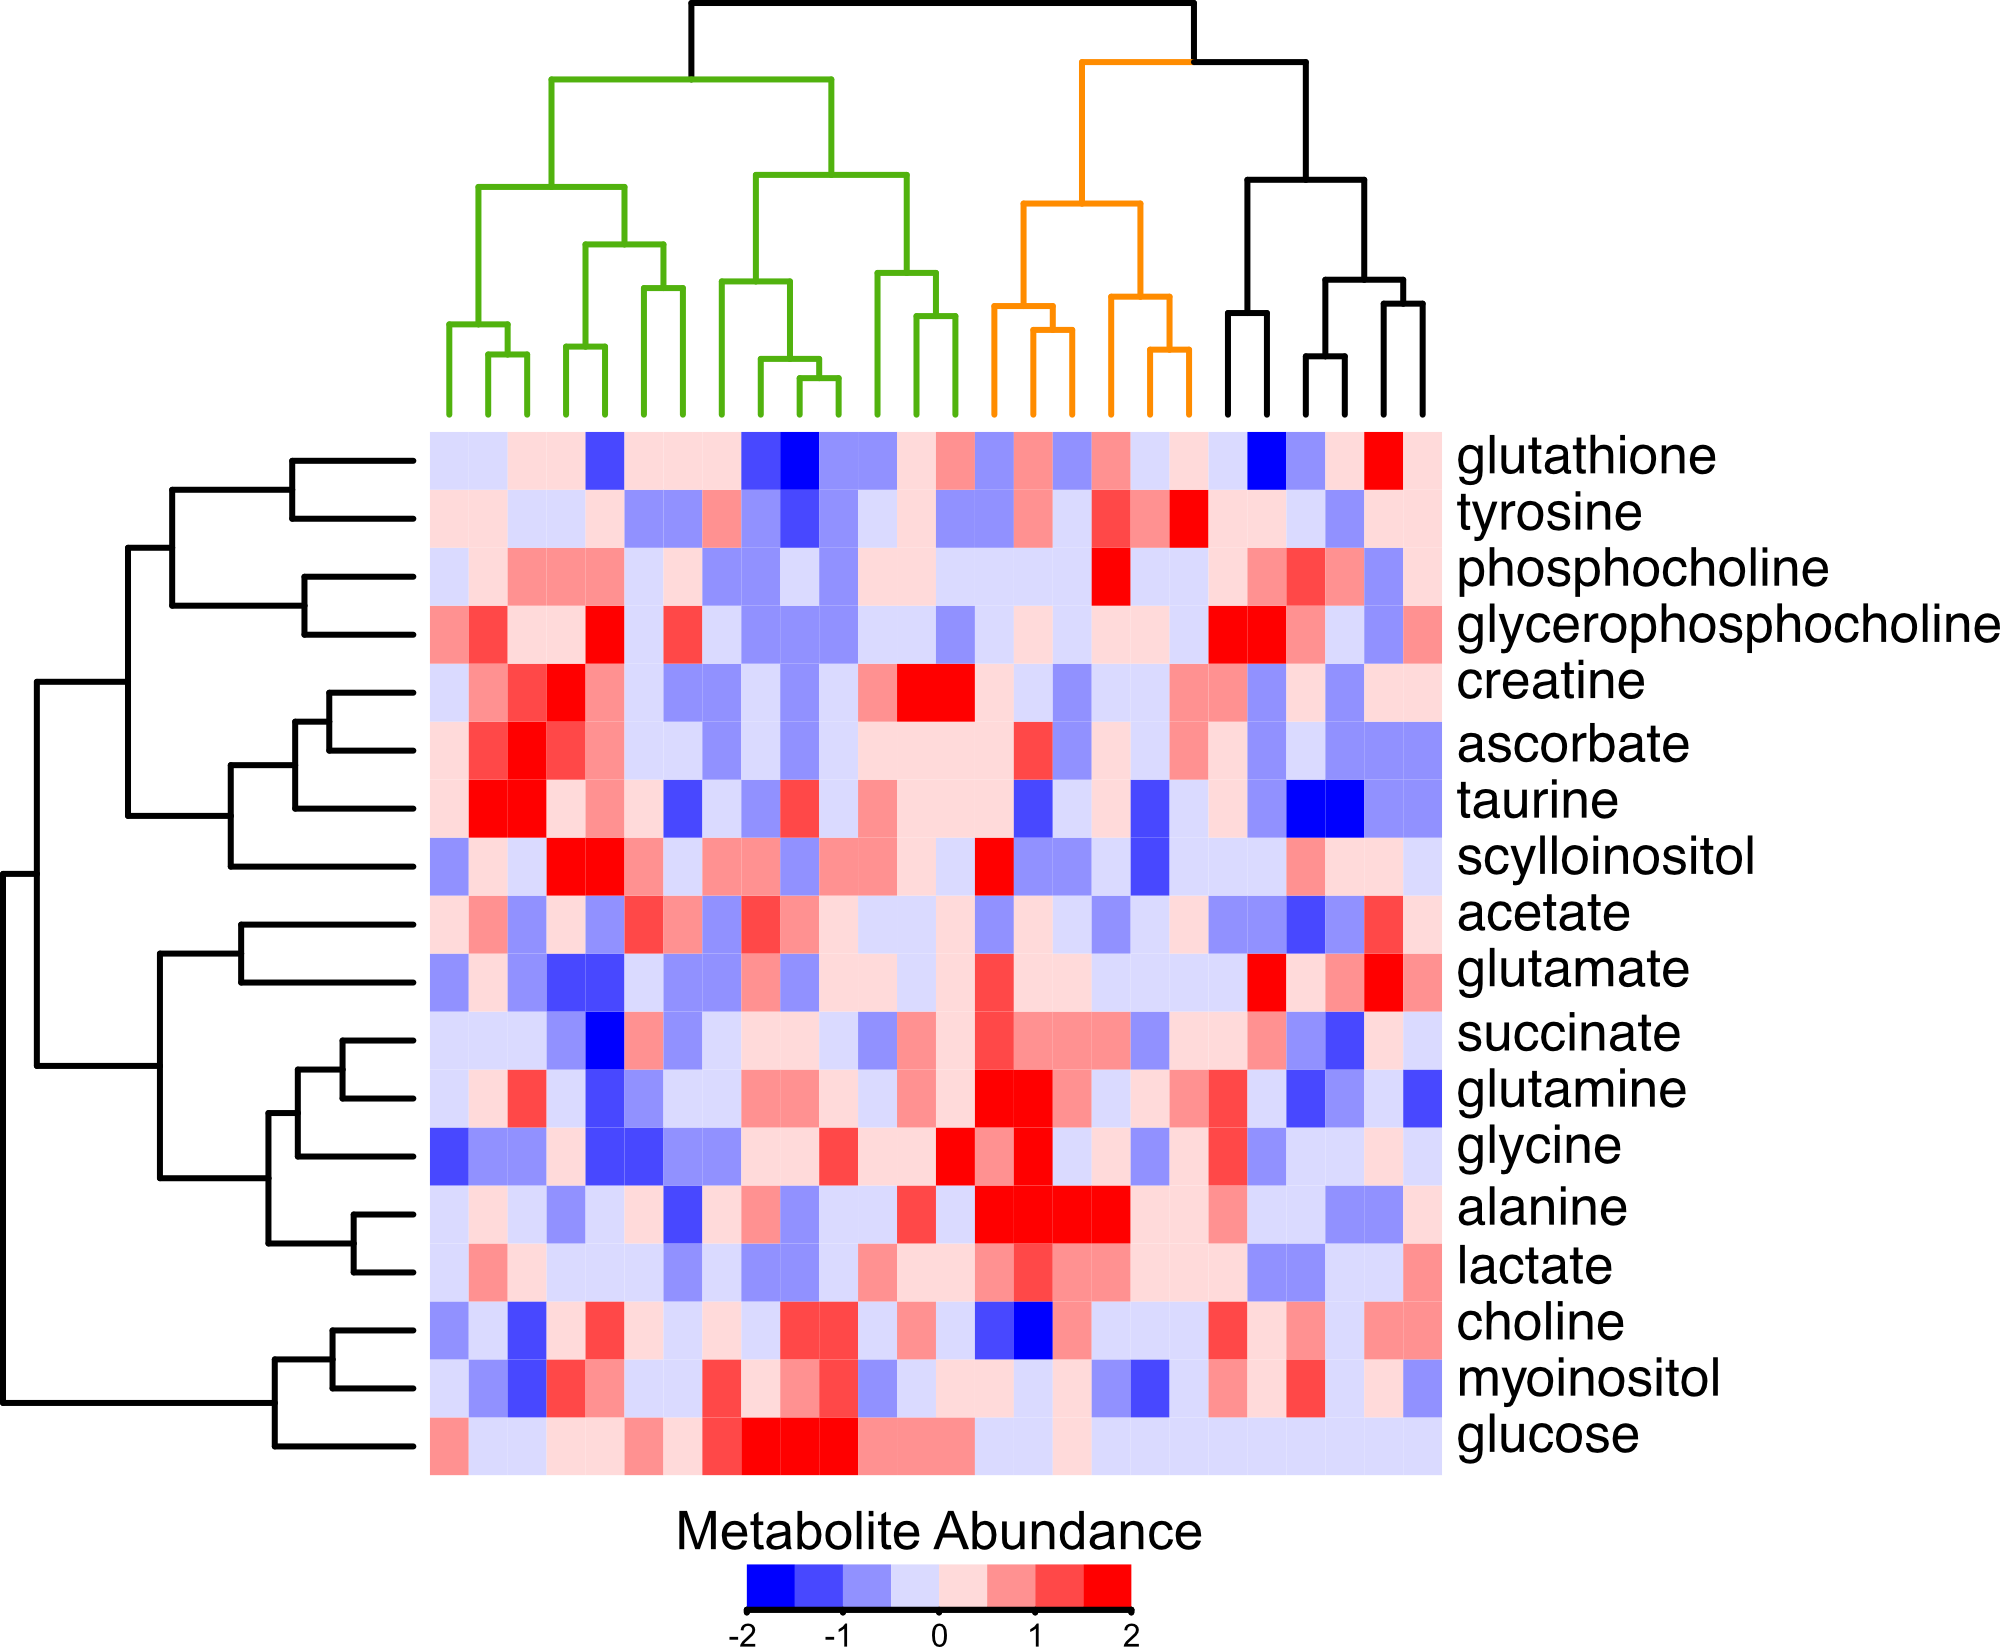
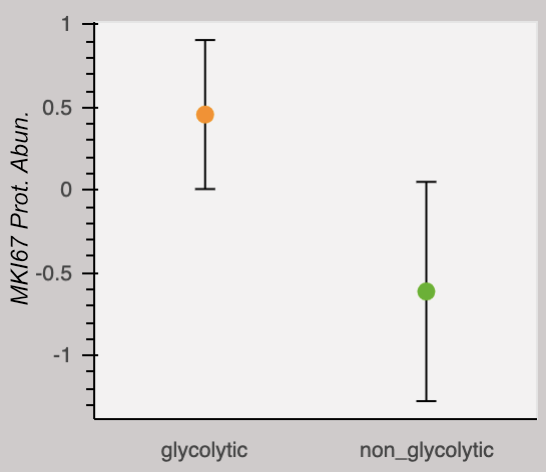
Our research group is interested in the metabolic adaptations breast tumors make to escape the effects of therapy. We believe these adaptations are fascilitated by alterations in protein abundances. This is motivated by the recent finding that analyses of breast tumor proteomes and metabolomes independently group tumors according to their capacity for proliferation. Thus metabolic function and protein signatures are linked. In the above heatmap, tumors are clustered by their metabolite profiles. A group termed "glycolytic" is marked by low glucose and high lactate and alanine (orange), and is exclusively composed of tumors clinically classified as proliferative. A group termed "non-glycolytic" (green) clusters separately. The glycolytic group has a higher abundance of the protein marker for proliferation, MKI67. We encourage you to explore the respective abundances of any of the 9,995 proteins quantified in this study by selecting them from the dropdown menu. Note there is no dropdown menu and the plot is not interactive on mobile devices or if the browser window is too narrow.
The above data is from Johansson, et al. Nature Communications 2019. Metabolite data is centered on the median, and normalized to the inner-quartile range. Metabolite abundances measured by non-destructive magic angle spinning nuclear magnetic resonance spectroscopy. Protein data is relative to an internal standard and log2 transformed. The dots represent the mean and error bars represent a standard deviation.